Growth Curve Estimation
Introduction
The Growth Curve for your Site of Interest is estimated using the pooled method, either the latest method, 2025, as presented by Veusviano and Griffin., 2025, or the 2008 method building on those developed by Kjeldsen et al., 2008. Note that the following guidance pertains to the 2025 method. Guidance relating to the 2008 method can be found in the Legacy Methods guidance.
If you have at-site AM data, the site can be included in the pooling procedure for an enhanced single site (ESS) estimate. WINFAP defaults to a recommendation of using the ESS if at-site data meet the pooling criteria (except that pertaining to URBEXT2015). If the data do not meet the criteria, you can still select to ‘use at-site data’ for the Growth Curve thereby entering your station into the pooling group.
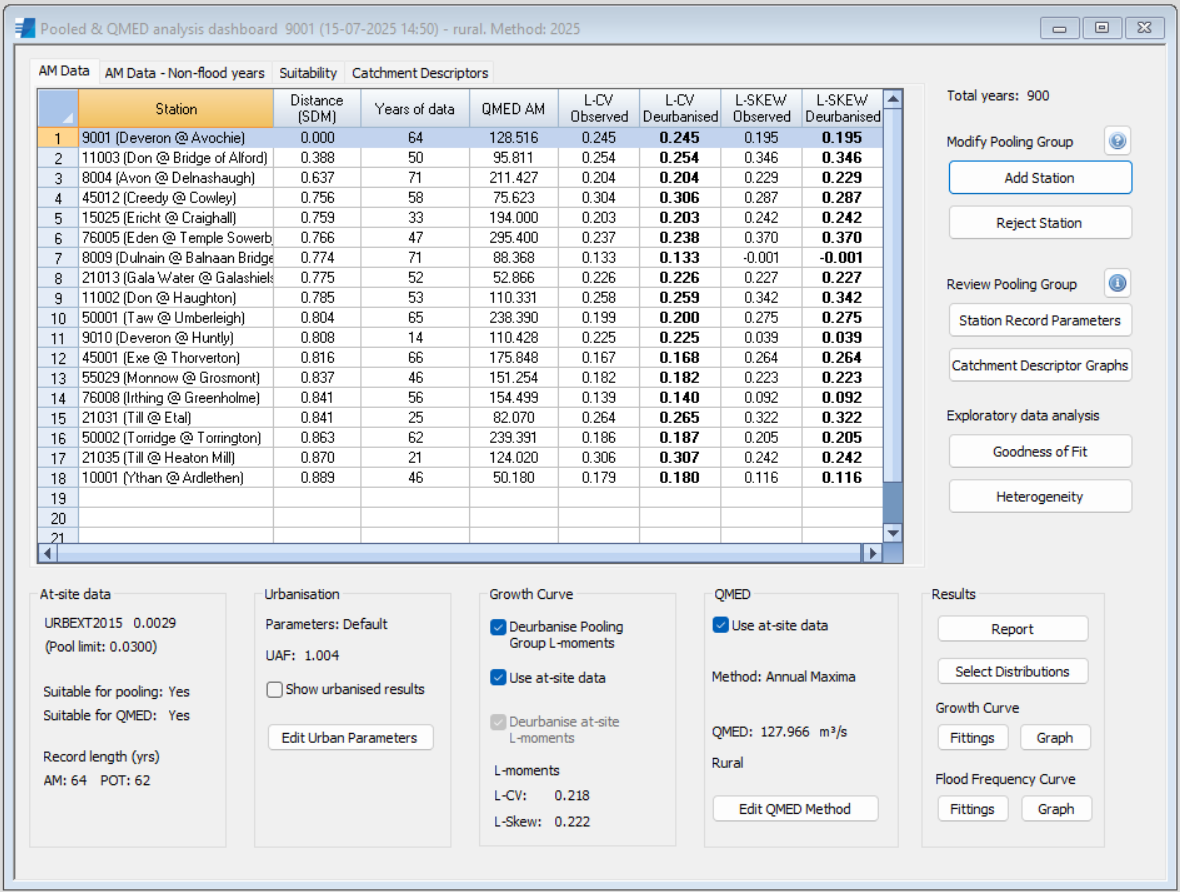
The 'Pooling & QMED Analysis' dashboard provides all the tools required to develop and assess the pooling group, as shown below.
Defining a pooling group
The estimated statistical properties of your Site of Interest's growth curve are estimated in the pooling procedure by taking a weighted average of the L-moments of the distributions of Annual Maxima (AM) data from a pooling group of hydrologically similar gauging stations.
When starting the Pooled & QMED Analysis method, a number of options are presented to you for use in developing the pooling group.
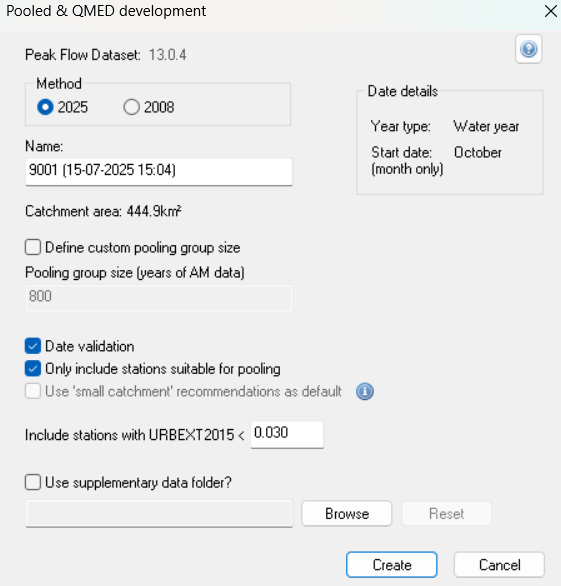
You should consider the following settings:
- Method: Option to choose 2025 or 2008 method. This defaults to 2025 method where the datasets (the Peak Flow Dataset and/or the Site of interest) contain the appropirate descriptors. Note that once the method has been assigned it cannot be edited within the current project.
- Pooling group size (years of AM data). This defaults to 800 years for the 2025 method.
- Only include stations suitable for pooling. This is selected by default.
- Include stations with URBEXT2015 < 'X'. This defaults to 0.03 which is categorised as 'essentially rural'.
- Use of Supplementary Folder. The pooling group is, by default, selected from stations in the default NRFA Peak Flow Dataset, identified in the Peak Flow Registry. The NRFA Peak Flow Dataset is also presented at the top of the option form. Additional stations can be added through the identification of a supplementary folder.
These settings can be reviewed from the main dashboard via the information icon next to Review Pooling Group.
The pooling group consists of multiple gauging stations across the UK which are judged as hydrologically similar to the target catchment. Similarity is identified using the FEH similarity distance measure (SDM).
The FEH SDM is estimated using the following equation as described in Vesuviano and Griffin, 2025:
There is no differentiation between small and large catchments in the 2025 method.
See Legacy Methods for the equations used in the 2008 method.
The pooling group members are presented in an expandable list in the sidebar.
Pooling group criteria
In addition to options presented to the user during initiation of pooled analysis, stations must satisfy the following criteria to be included in the pooling group:
- There are at least 5 years of AM data. It is preferable to have at least 8 years of AM data.
- Catchment descriptors (AREA, SAAR9120, FARL2015, FPEXT, BFIHOST19scaled) are known.
- Catchment area ≥ 0.5 km².
You are encouraged to review the pooling group to ensure that the best stations are selected to predict the Growth Curve for your Site of Interest. Consideration should be given to the quality of the peak flow data for stations in the pooling group. The dashboard provides comprehensive options for reviewing and refining the pooling group:
- The AM Data tab, AM Data - Non-flood years tab, Suitability tab, and Catchment Descriptors tab allow you to explore the gauging station details in tabular form whilst the Review Pooling Group options provide relevant graphics and graphs for these stations. Stations are highlighted in red where various suitability criteria are not met in the Suitability tab.
- The Modify Pooling Group section allows you to edit pool membership.
- The Exploratory Data Analysis options enable you to evaluate the pooled estimate of the Growth Curve.
Data for a site can be edited via the Station Manager or Single Site Analysis Dashboard. To ensure consistency between the Site of Interest and pooling group members, it is recommended that any edits to the Site of Interest data are completed prior to selecting 'Pooled & QMED Analysis'. Changing the descriptors or flow data at a site may affect the selection of stations in the pooling group and the data used to define the growth curve therefore once a pooling group has been produced you will not be able to edit any site details.
At-site data
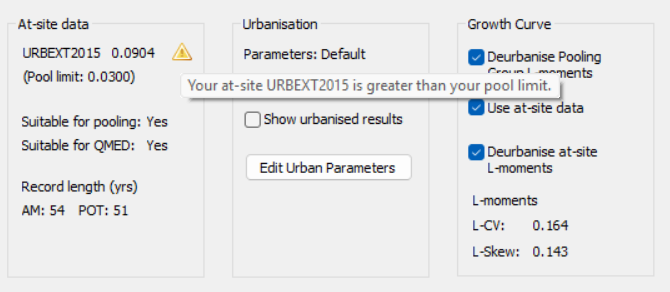
Details of the at-site data are provided. For a gauged site this will provide information on the URBEXT2015, the suitability criteria and the record length available at the site. Where the URBEXT has been modified via 'Edit Urban Parameters' this will be updated to the user defined URBEXT value.
Where the site has an URBEXT2015 (or URBEXT) greater than the threshold set for stations to be included in the pooling group a warning will be presented. If you are using the ESS method, where at-site data is used within the pooling method, you should make an assessment of whether it is appropriate to include the station within the pooling group. Given the improvement in estimates associated with the use of local observed data it will often be the case that it will be appropriate to retain the station within the pooling group.
Urbanisation
For the Site of Interest and those in the pooling group, you have the option to de-urbanise the L-moments for use in the Growth Curve development procedure. See the section on Urbanisation for more details. The default settings for this can be over-ridden but warnings are provided where selections are inconsistent.
Pooling group table
You can inspect various parameters of your pooling group stations in the Pooling Group Table. The data are tabulated in four tabs: 'AM Data', 'AM Data - Non-flood years', 'Suitability' and 'Catchment Descriptors'.
AM data tab
- Distance (SDM): this is the similarity distance measure between your Site of Interest and the pooling-group station calculated using the respective descriptors. Smaller values are associated with stations that are more hydrologically similar to your Site of Interest.
- Years of data: the number of years of AM data in the record.
- QMED AM: the observed QMED calculated from the AM data.
- L-CV Observed, L-SKEW Observed: sample L-moments of the AM series.
- L-CV Deurbanised, L-SKEW Deurbanised: deurbanised sample L-moments of the AM series.
You can select to use the observed or deurbanised L-moments. The values used in the analysis are shown in bold. See urbanisation procedures for more details on default and recommended settings.
AM Data - Non-flood years tab
This tab is for the data relating to non- flood years. See the Non-flood years and Trends section for more details .
- Years of data: the number of years of AM data excluding non-flood years.
- L-CV Observed NFY, L-SKEW Observed NFY: sample L-moments of the AM series excluding non-flood years.
- L-CV Deurbanised NFY, L-SKEW Deurbanised NFY: deurbanised sample L-moments of the AM series excluding non-flood years.
Suitability tab
- Suitability for QMED and/or Pooling.
- Years of data: the number of years of AM data in the record.
- No. of Non-flood years: the number non-flood years in the record.
- Percentage Non-flood years: the percentage of 'non-flood' years the record.
- Mann-Kendall (MKZ): the Mann-Kendall Z statistic; used to identify whether a trend is present within the AM data.
- MKZ Significance (%): the significance of the Mann Kendall z statistic. This is presented as 'none', 5% or 10%.
- Discordancy: a measure of how different the station's L-moment ratios are from the pooled L-moment ratios. A higher value indicates a greater disparity between the station's distribution and the pooled 'average'.
- Comments: you can add comments to be saved against a station. This could include, for example, reasons why you might have rejected a station.
- A dynamic link to the NRFA Flow Trend Explorer AMAX plots for the specific station. The 'Triangle Trends' plots can also provide useful information on non-stationarity at a station. Please note that a security certificate warning may be associated with this site. You can over-ride this by proceeding to the 'advanced' option.
On the suitability tab stations are highlighted in red to assist in the identification of:
- Stations with short records (less than 8 years of data).
- Stations deemed to be not suitable for use in a pooling group or for the estimation of QMED in the NFRA Peak Flow Data.
- Stations with a significant discordancy measure.
Catchment descriptors tab
- Distance (SDM): this is the similarity distance measure between your Site of Interest and the pooling-group station calculated using the respective descriptors in the similarity equation. Smaller values are associated with stations that are more hydrologically similar to your Site of Interest.
- AREA: catchment area (km²).
- SAAR9120: Standard Annual Average Rainfall (SAAR) in mm for the period 1991 to 2020, a measure of catchment wetness.
- FPEXT: an index of floodplain coverage within the catchment.
- FARL2015: an index of flood attenuation attributable to reservoirs and lakes based on LCM 2015 (Rowland et al., 2017).
- URBEXT2015: the extent of urban and suburban landcover based on LCM 2015 (Rowland et al., 2017).
- BFIHOST19scaled: a revised Base Flow Index derived using the UK Hydrology of Soil Types (HOST) classification (Griffin et al., 2019) recalculated to remove 'water'.
- A dynamic link to the NRFA station's page.
Rejected stations are listed below the main table in pale grey.
Any stations that have been modified or those from the supplementary folder will be highlighted using * or + characters respectively.
Modify pooling group
'Add Station' and 'Reject Station' allows you to add and reject stations from the pooling group. Rejected stations are listed below the main table in pale grey. Note that where at-site data has been rejected this will not be presented within the list of rejected stations.
Add station
On selection of 'Add Station' a list of the appropriate stations in the station manager is displayed.
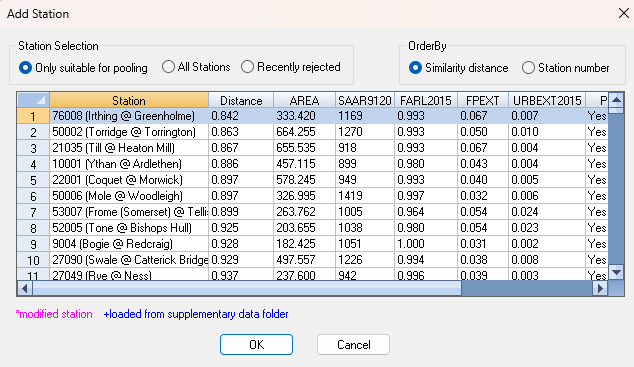
You can change which stations are displayed using the Station Selection Criteria, and order by the 'similarity distance' or 'Station number'.
All stations previously rejected are displayed in grey. Stations that have been modified or from the supplementary data folder are also highlighted.
When a station is added that has a higher SDM than other stations available, all stations with an SDM lower are considered to have been rejected.
Reject station
To remove a station from the pooling group, highlight the station in the pooling table and select the 'Reject Station' button.
Review pooling group
The 'Review Pooling Group' section provides the ability to review the data and criteria used to create the pooling group via the information icon. In addition, a number of graphs and the spatial location of stations can be viewed which can be saved as a png using the save icon. All graphs (except the UK map) can be queried to provide additional information.
Station Record Parameters
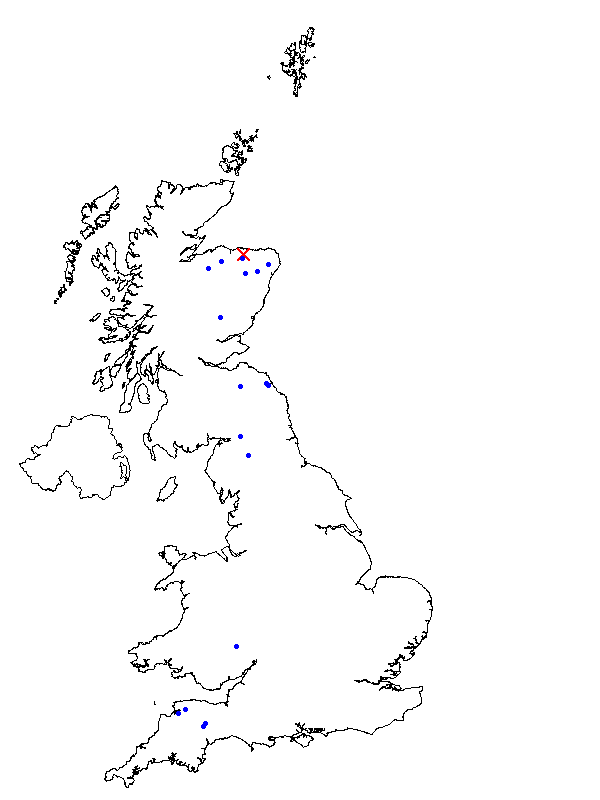
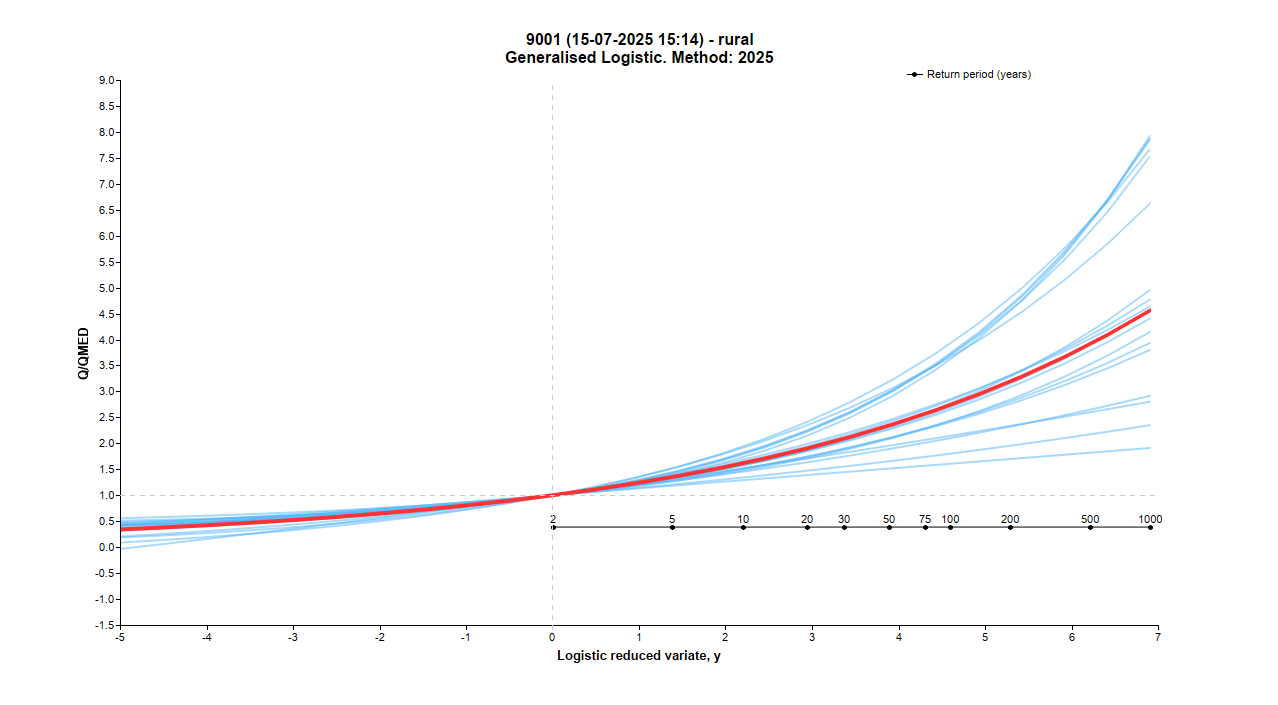
These consist of a UK map of the pooling group gauging stations and further graphs showing the flood seasonality, L-moments, 3D L-moments and Site growth curves (for the pooling group stations). Examples for the Deveron at Avochie of the UK map and the Site growth curves are presented below.
A discussion on the importance of flood seasonality and the derivation of the seasonality circular statistics can be found within the Flood Estimation Handbook Volume 3, Chapter 16. The mean time of year at which floods occur is summarised by the angle and the concentration is summarised by the distance from the origin. If floods usually occur at the same time of year i.e. they are strongly seasonal, then the concentration is close to 1, if the concentration is small then the seasonality is less strong.
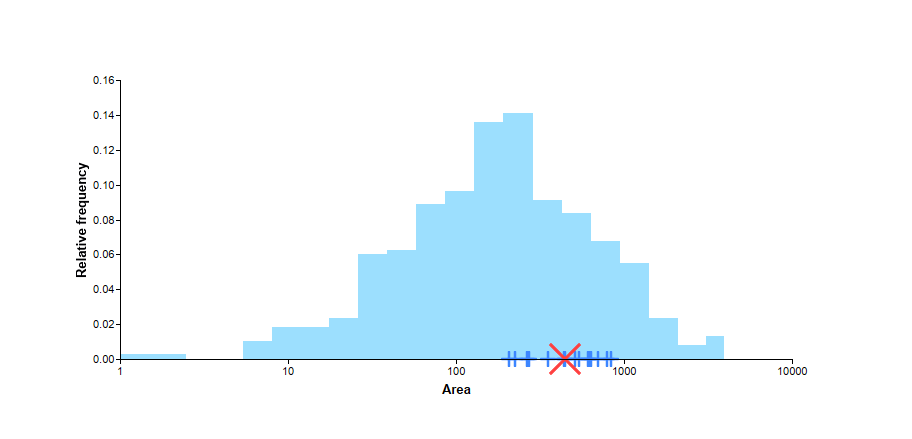
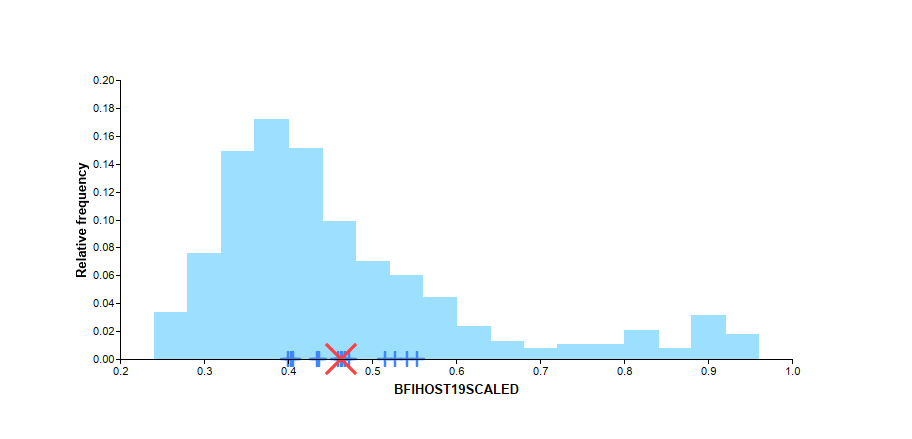
Catchment Descriptor Graphs
These consist of the ‘location’ of your Site of Interest in the data space of a variety of catchment descriptor variables. Your Site of Interest is shown as a red cross (x) and the members of the pooling group as blue plus (+) on a histogram which reflects the variability of the available stations in the Peak Flow Dataset. Examples for the Deveron at Avochie for Area and BFIHOST19scaled are presented below.
Exploratory data analysis
The two Exploratory Data Analysis methods, ‘Goodness of Fit’ and ‘Heterogeneity’, are intended to assist in your choices about pooling group membership. They should not be used in isolation to refine pooling groups; expert judgement is essential. Please note that both these methods use random sampling hence, for a given site and settings, values will vary.
The background to the diagnostic tools is presented in Flood Estimation Handbook Volume 3, Chapter 16.
Distribution selection
The growth curve can be estimated using a number of different distributions.
Following publication of Kjeldsen et. al., 2017, the Kappa 3 distribution, a 4 parameter distribution, has been added to the list of distributions which can be used in the growth curve estimation process. The GLO, GEV, and GPA distributions are specific applications of the Kappa distribution where ξ is the location parameter, α the scale parameter and κ the shape parameter. The 4th order parameter, 'h', is set to -1, 0, and 1 respectively for each of these distributions. Based on the research, the Kappa 3 distribution uses a fixed 'h' of -0.4; the optimum value found for UK catchments.
For the Generalised Logistic distribution it is also possible to complete analysis using the non-flood years method. In this method 'non-flood years', defined as those in which the AMAX does not exceed QMED/2, are removed and the L-moments are modified accordingly. See Non-flood years and Trends section for more details.
By default the Generalised Logistic, Generalised Extreme Value, Kappa 3 and Generalised Logistic for Non-flood years distributions are selected. Kjeldsen et al., 2010 showed that the Generalised Logistic distribution is, in the main, the preferred distribution in the UK, however other distributions should also be considered.
The Goodness of Fit tools can aid in the selection of the appropriate distribution.
Uncertainty
Determining the uncertainty associated with the estimation of the growth curve using pooling groups is complex given that the 'true' value of the peak flows associated with longer return periods are unknown. This is different to the estimation of the QMED where observed records are generally long enough to enable estimation of the 'observed' value. The UKCEH short guide for FEH users (Griffin et al., 2025) includes information on the PUM (Pooled Uncertainty Measure, used in the development of methods), as well as methods for estimating the combined uncertainty associated with the QMED and growth curve for a number of return periods and donor stations (the latter related to those used for the estimation of QMED). The guide also provides links for further reading.