Summary Information
Once a Site of Interest has been loaded you can select 'Summary Information...' from the r-click menu. There are three tabs, 'AM', 'POT' and 'QMED'. If the site is ungauged then only the 'QMED' tab will be displayed. For clarity the method that is currently selected (2008 or 2025) will be displayed. Where no method has been selected this will be based on the default version of the NRFA Peak Flow dataset.
AM
The 'AM' table allow you to view information relating to the AMAX data held for the site.
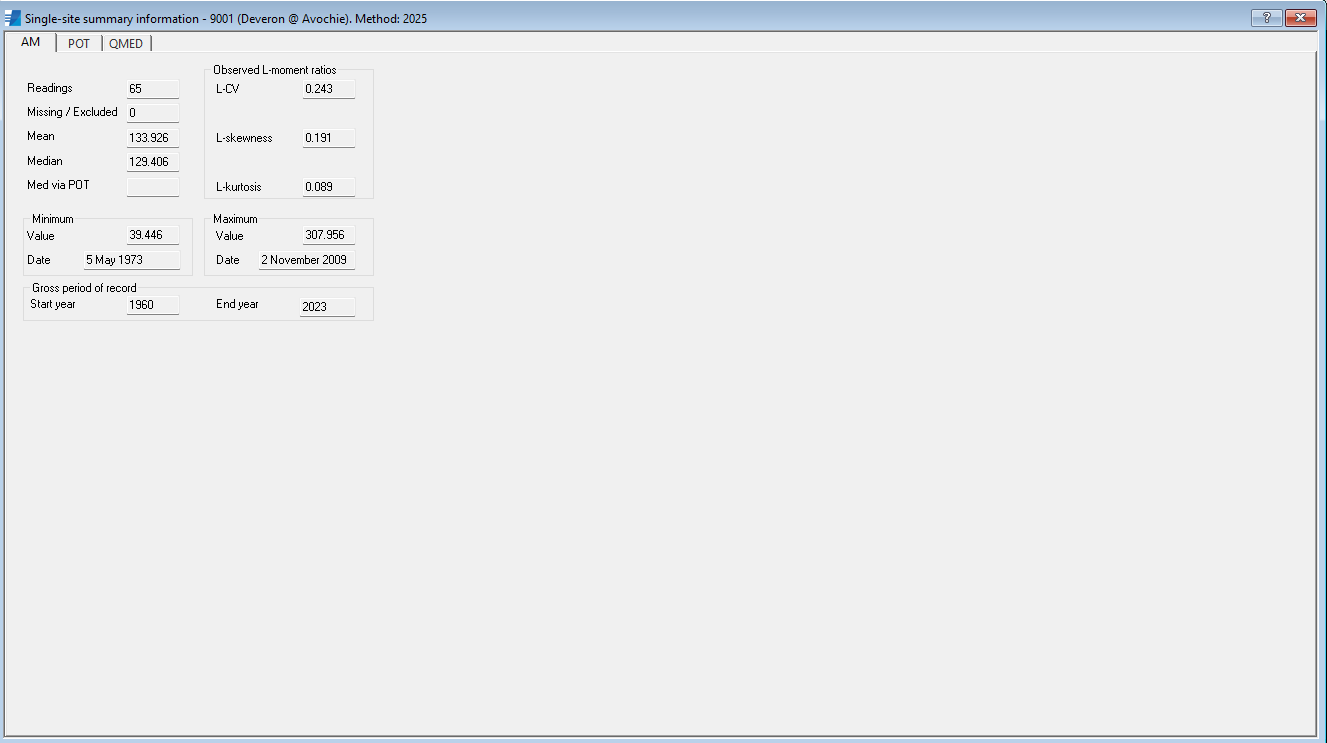
This includes the number of years of data, the Median value (equivalent to the QMED) and the observed L-moment ratios. If it is appropriate to use POT data then this will also be displayed alongside the Median value ('Med via POT'). See Project Options and QMED estimation for more information.
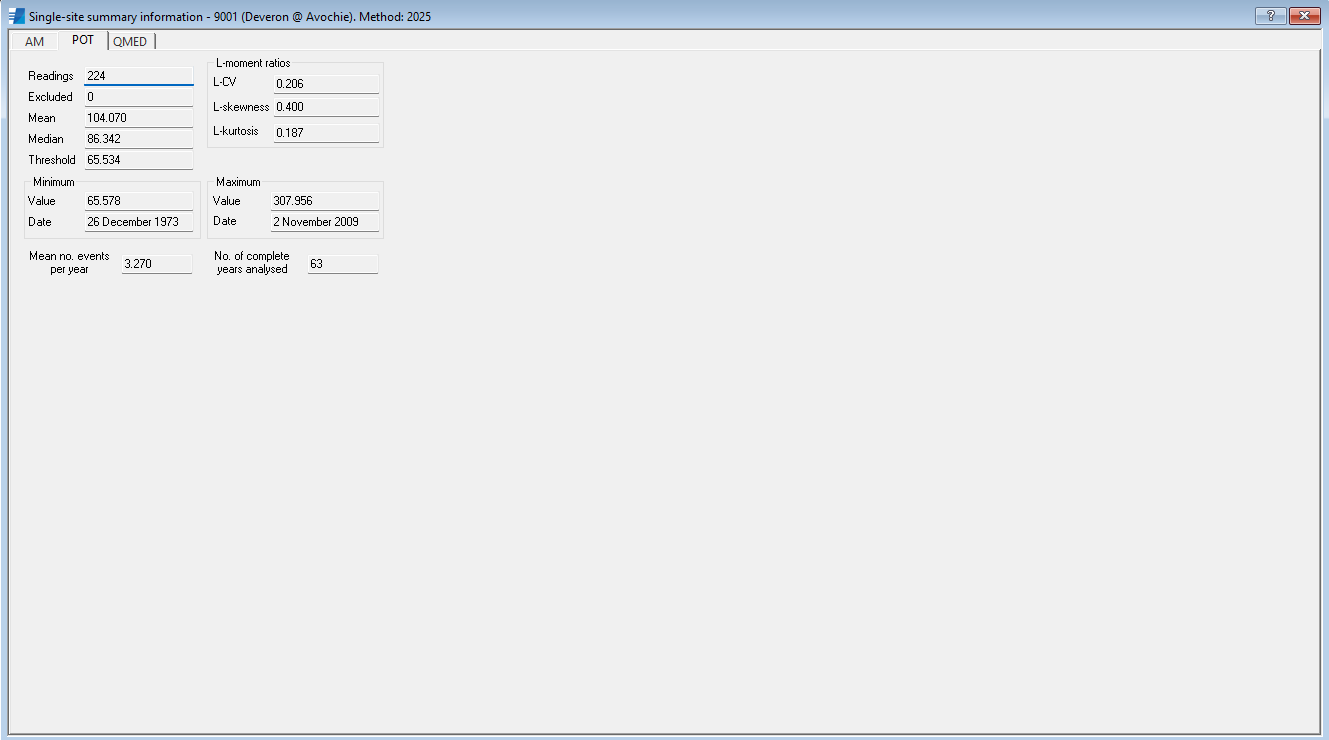
POT
The 'POT' tab similarly presents information relating to the POT data. As with the AMAX data, this includes how many readings are available as well as well as the L-moment ratios.
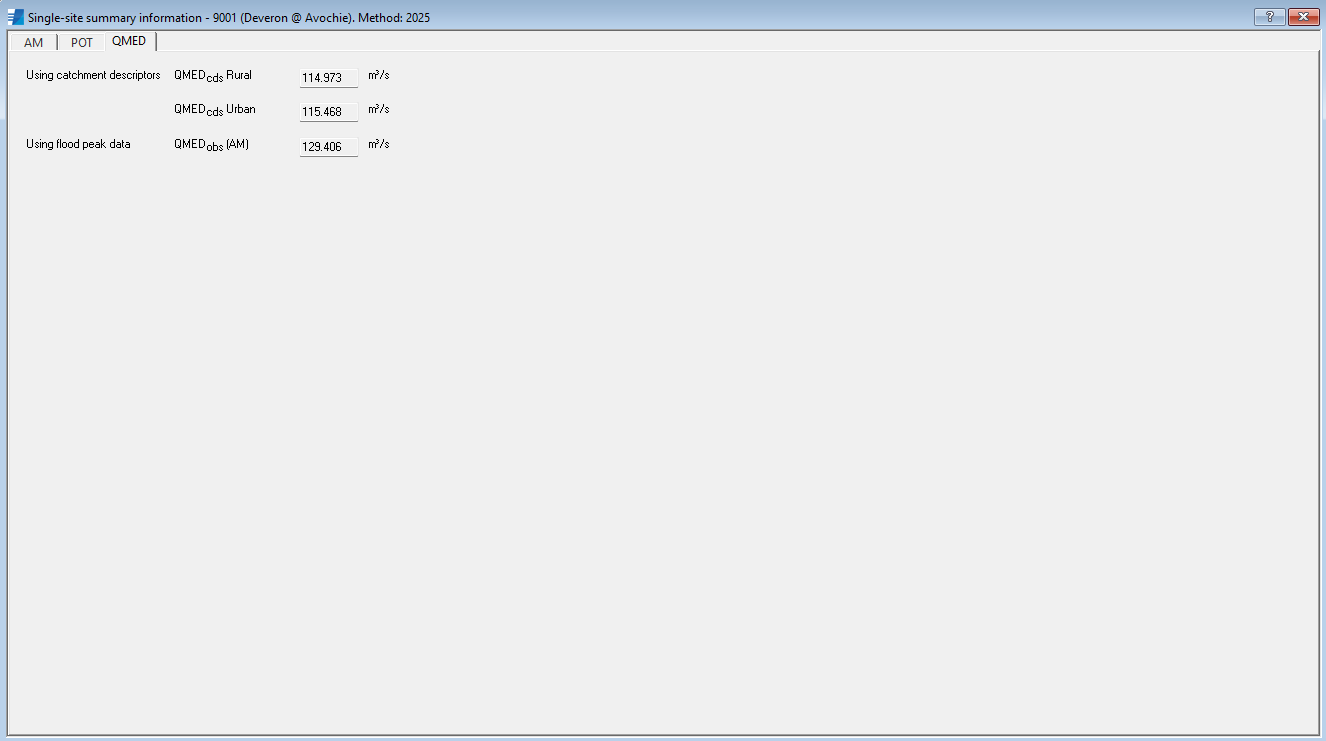
QMED
The 'QMED' tab presents the QMED estimates using catchment descriptor data and flood peak data. The QMED estimated using catchment descriptor data may be based on the 2008 or 2025 method. For clarity the method used is displayed at the top of the form. If you have selected to 'Estimate QMED from POT' within the Project Options then, if the POT is deemed to be the 'best' estimate of QMED, then the POT estimate will be presented. If this option has been deselected then the QMEDobs will always be based on the AMAX.