Singe Site Analysis
The Single Site Analysis dashboard enables you to interrogate and edit all the flood data and contextual data held about a Site and can be accessed via the r-click menu items associated with the Site of Interest.
The Single Site Analysis options are grouped on the right-hand side of the dashboard. The Single Site Analysis is based on an observed flood series of Annual Maxima (AM) at the Site of Interest and therefore cannot be applied to ungauged sites. For ungauged sites the analysis options will be greyed out.
Site Data
Catchment Descriptors Data
The catchment descriptors are presented for both ungauged sites and gauged stations. The data may be edited using the edit options.
Annual Maxima and Peaks Over Threshold Data
The peak flow data (AM and POT data) are presented in tabular format for gauged stations in the 'Annual Maxima' and 'Peaks Over Threshold' tabs. These can be graphed using the ‘Time Series Graphs’ button. The data may be edited using the edit options.
The number and percentage of of non-flood years are also presented; see the section on non-flood years for more details on this.
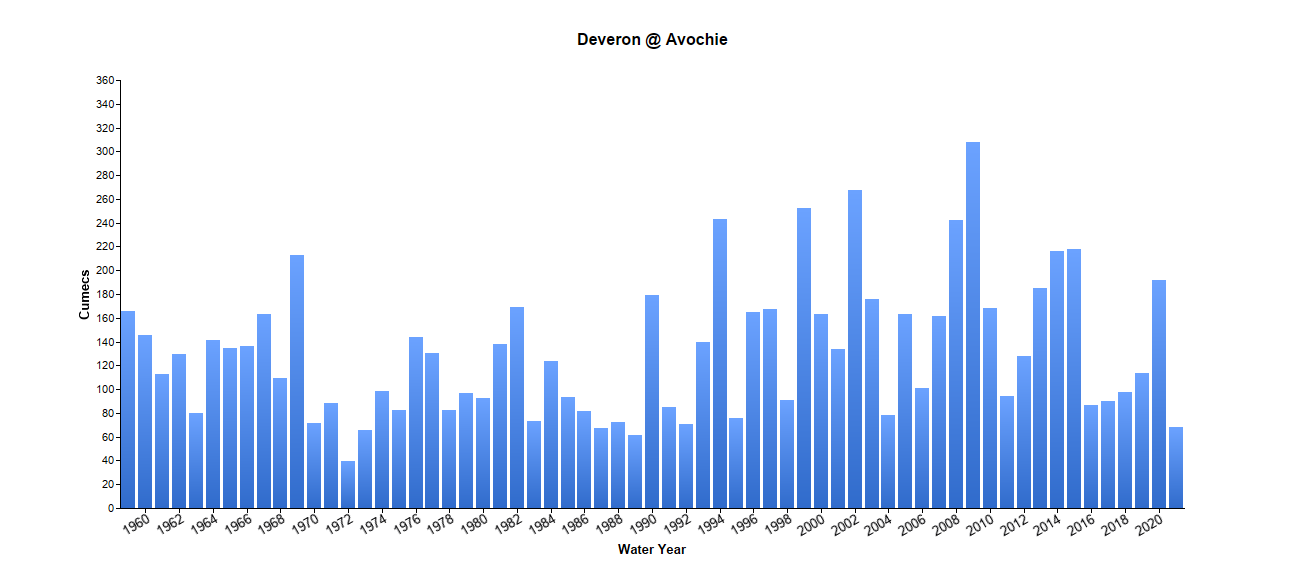
An example of the time series graph for AM data for the Deveron at Avochie is presented below.
Single Site Analysis
The AM data can be fitted to a distribution so that peak flows can be estimated for given return periods and vice versa. When extrapolated to the typical return periods used in fluvial flood studies, single-site growth curves can be very vulnerable to the effects of:
- the period of record that the gauging station happens to cover;
- the quality of high flow data.
These limitations are reduced through pooling of AM data from multiple gauging stations.
Distributions
By default the Generalised Logistic distribution is selected for use in the analysis. Kjeldsen et al., 2008, found that the Generalised Logistic distribution, with the L-median fitting method, was generally found to be the 'best' distribution for UK catchments. The L-median fitting method uses the L-moments after standardising by the median, so that the location is always 1. It is recommended that other distributions are considered and these can be added using 'Select Distributions'. For more information on different distributions and their suitability refer to the Flood Estimation Handbook Volume 3 Section 14.4 and Kjeldsen et. al., 2017.
'Station Fittings' and 'Individual Distribution Fits' allow you to view the selected distribution parameters together with estimates of the FFC or Growth Curve (depending on the standardisation setting) for the selected return periods.
The 'Individual Distribution Fits' dashboard also allows you to ‘Calculate Confidence Intervals’ which once selected can be viewed on the selected graphs. The various settings for the confidence intervals can be selected within Options> Project Options. In addition, the ‘Flood Statistics Calculator’ button enables you to estimate the peak flow corresponding to a return period and vice versa for the selected distribution.
Standardisation, Growth Curves and Flood Frequency Curves
The 'Standardise' options determine whether the tabulated data presented in the 'Station Fittings' and 'Individual Distribution Fits' dashboards and on selecting 'Flood Frequency Curves' is the Flood Frequency Curve (flow in cumecs) or the Growth Curve (standardised by median):
- If 'Not standardised' the tabulated data in the 'Station Fittings' and 'Individual Distribution Fits' dashboards and on selecting 'Flood Frequency Curves' is the Flood Frequency Curve (flow in cumecs).
- If 'Standardised by median' is selected in the ‘Standardise’ options then tabulated data and the graphs presented in 'Flood Frequency Curves' is the Growth Curve (standardised by median).
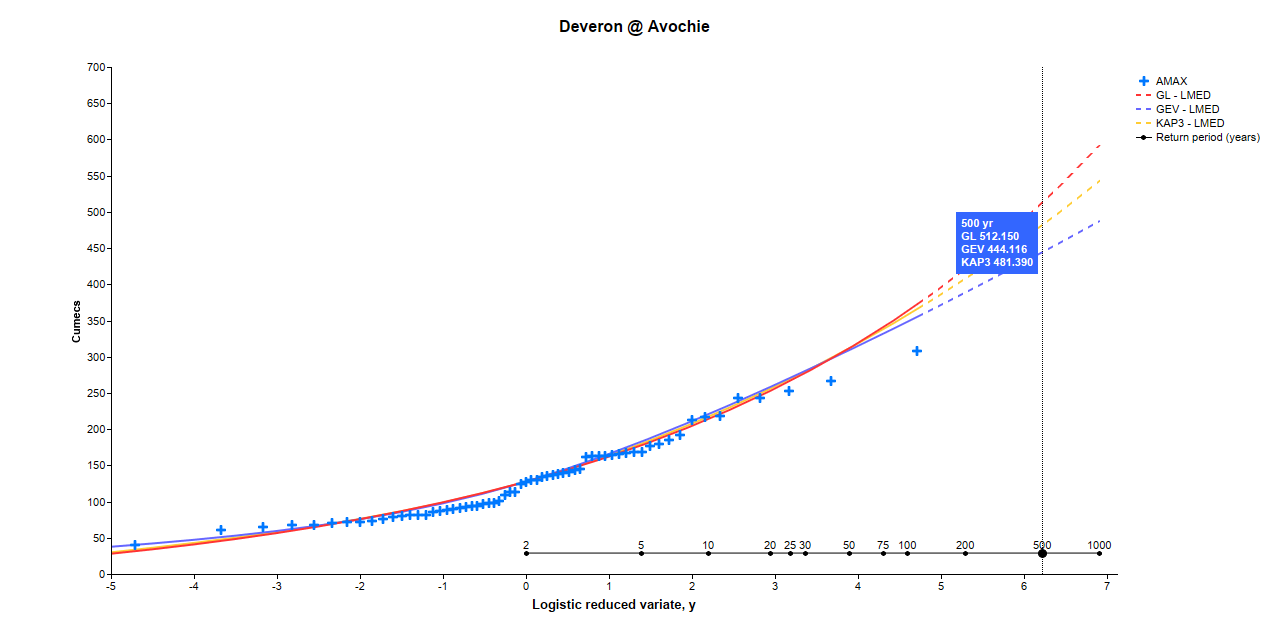
The ‘Flood Frequency Curves’ button plots flow (not standardised) or Q/QMED (standardised by median) on the y-axis against the logistic reduced variate, y, on the x-axis. The user defined return periods, corresponding to the relative logistic reduced variate, are also plotted on the x-axis. This allows you to graphically determine a flow value for a given return period based on the Flood Frequency Curve.
An example of the Flood Frequency Curve for the Deveron at Avochie, illustrating the tooltip, is presented below.
As with the tabled results the settings for how the confidence intervals data should be presented within the graph can be selected within Options> Project Options.
Editing Data
The site data can be edited via specific 'Edit' buttons in the 'Station detail' section or the 'Annual Maxima, 'Peaks Over Threshold' or 'Catchment Descriptors' tabs.
You will need to 'Save within project' before closing the Single Site analysis dashboard or switching to another site, as any unsaved edits are discarded. If data has been edited then the site is identified by a * in the sidebar, as well as in the Pooling Group tables and QMED Donor table.
The edits are project specific. This means that the edited site is utilised in the project and saved in the Project File, but edits are not saved externally or used in future projects.
If the site edited data are required for other projects, the .xml, .AM or .PT files can be exported using the 'Export Site' button. See Station Manager for more details. These can then be added to a supplementary folder or imported as the Site of Interest for use in a new project.
AM and POT records can be rejected or excluded. Excluded records are only excluded within the project, therefore records should be rejected if the site will be exported for use in new projects.
To ensure consistency between the Site of Interest and pooling / donor group members, it is recommended that any edits to the Site of Interest data are completed prior to selecting Pooled & QMED Analysis. Whilst any site edits implemented (e.g. annual maxima edits) are used in the calculations for existing pooling / donor groups, the membership of any existing groups is not updated. It is therefore recommended that previous Pooled & QMED Analysis is removed and regenerated following any edits to site data (e.g. SAAR) that is used in selecting stations for the pooling / donor groups. Following these recommendations will prevent any potential inconsistent results.
Note that the trend statistic (MKZ) is not calculated internally hence will NOT be updated if the AM data is edited.
Confidence Intervals
Through the selection of 'Confidence Intervals' these can be added to the graphs and tabulated data. The Options Menu allows the selection of the sampling strategy and percentiles that are to be presented. The methodology used is summarised within the UKCEH short guide for FEH users Griffin et al., 2025.