Options Menu
You can adjust various settings under Options. Project Options... are project specific (i.e. they are valid for the current project only), whilst User Options... are persisted and associated with the specific user. The Return Period Options can be set as a default set by the User, as well as having a specific set of return periods for a given project. It will not be necessary to modify the default settings for most users.
Return Period Options
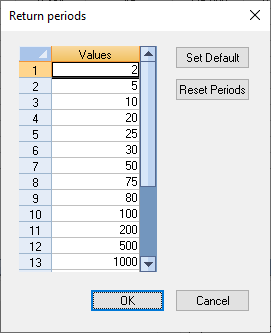
Selecting Options>Return Period Options... displays a list of the return periods used within growth curve estimation.
The initial return periods presented are 2, 5, 10, 20, 25, 30, 50, 75, 100, 200, 500, 1000.
You can modify these by adding or removing return periods. In the example below the 80 year return period has been added. If you select 'Set Default' then this will be persisted within your User settings. Any other changes will only be valid within the present project. If return periods have been edited and you want to return to the User default settings then selecting 'Reset Periods' will revert the return periods to those within your User settings.
Project Options
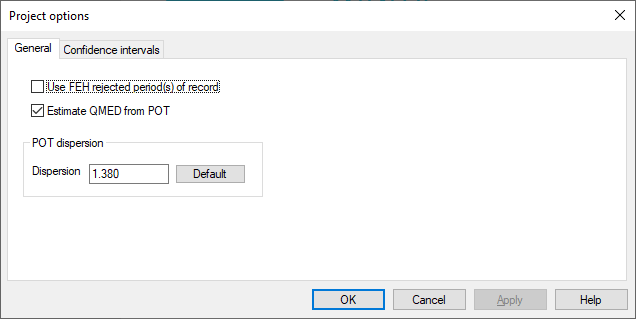
Selecting Options>Project Options... allows you to change some of the settinsg relating to the use of observed data and confidence intervals. Any changes to these will be valid for the current project only.
The 'General' tab allows you to set whether to include FEH rejected period(s) of record and whether QMED should, where appropriate, be estimated from POT data. If the latter is selected then if the number of years of POT data is greater than 0 and less than 20 years, then POT will be considered as suitable for estimating the QMED. The POT QMED estimate will be selected as the 'best' method if there is less than 14 years of AMAX data and the number of POT data is greater than the number of AMAX.
The dispersion to be used for the POT is also provided. By default this is the average value for the UK as described in Robson et al., 1999.
The 'Confidence intervals' tab allows allows you to set the settings used to display the intervals based on balanced resampling used in Single Site analysis.
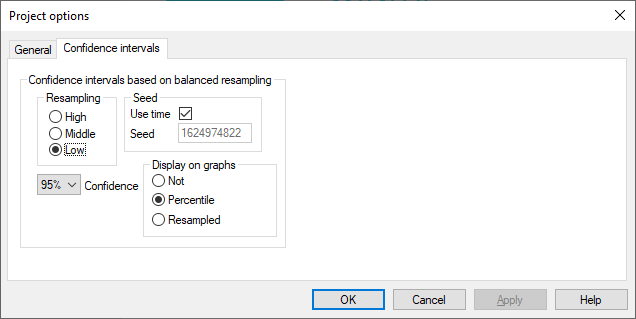
'Resampling' allows you to define how many times to resample the data where 'Low' is 199, 'Middle' is 999 and 'High' is 4999.
'Seed' allows you to define the starting seed for the random sampling. Selecting 'Use time' will effectively allow random resampling each time.
'Display on graphs' allows you to select the appropriate confidence limits to use and whether the confidence limits, if these are selected within the Single Site Analysis dashboard, are displayed in the Flood Frequency Curve (FFC) graphs. 'Percentile' displays the given confidence limit only whilst 'Resampled' presents all individual sampled FFCs.
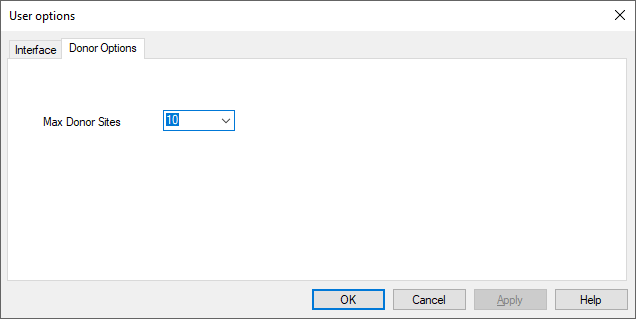
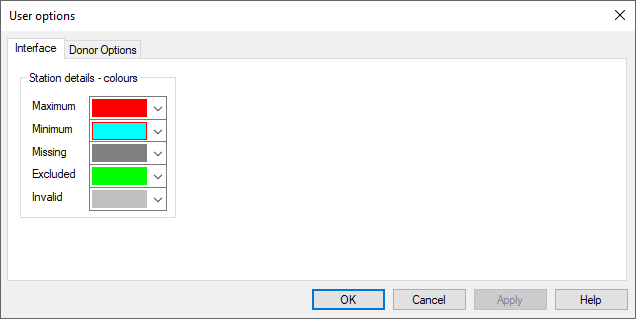
User Options
User options allow you to personalise the interface settings and donor options. These settings are associated with the user and are not project specific.
The 'Interface' tab allows you to modify the colours which highlight specific AM data on the Single Site dashboard.
The 'Donor Options' tab relates to the number of stations that are considered for use within the QMED estimation using Donor Adjustment method.