![]()
The FEH Methods
Originally published in 1999, and subject to continuous development, the Flood Estimation Handbook (FEH) comprises the standard methods for estimating flood frequency. There are two core handbook methods:
- the statistical method for estimating flood frequency curves implemented through WINFAP; and
- the event-based rainfall runoff method for estimating hydrographs for floods of a specified frequency and hence flood frequency curves implemented through ReFH 2.
WINFAP
WINFAP enables you to estimate peak flows and flood frequency curves (FFC) for gauged and ungauged catchments using the latest Flood Estimation Handbook (FEH) statistical methods for flood estimation.
At an ungauged site you can automatically create a pooling group of similar gauged sites based on comparison of FEH Web Service catchment descriptors. An FFC is created through analysis of the pooling group flood peak data.
At a gauged site you can apply flood frequency analysis techniques to gauged annual maximum and/or peaks-over-threshold flood peak data where available.
The core estimation methods in WINFAP are:
- Pooled & QMED analysis for ungauged catchments – most commonly used.
- Pooled, QMED and Enhanced Single Site analysis for gauged catchments – use at-site data to improve your estimate.
- Single Site Analysis – analyse at-site flood peak data in isolation of other catchments.
- Historical Data Analysis – extend at-site records with information on flood events that occurred before formal measurement began.
Below we provide an introduction to the FEH statistical method, which is expanded upon throughout this guidance. Getting Started provides a quick summary of how to start using WINFAP 5, whilst What's new in WINFAP 5 provides a summary of the main updates to WINFAP 5. We recommend that you read the guidance on Data Management prior to using the software.
Uncertainty in the FEH methods is summarised in the UKCEH short guide for FEH users (Griffin et al, 2025).
While WINFAP provides a framework for FFC estimation it is important that you have the appropriate technical and regulatory knowledge required to use the software effectively.
Introduction to Flood Frequency and Growth Curves
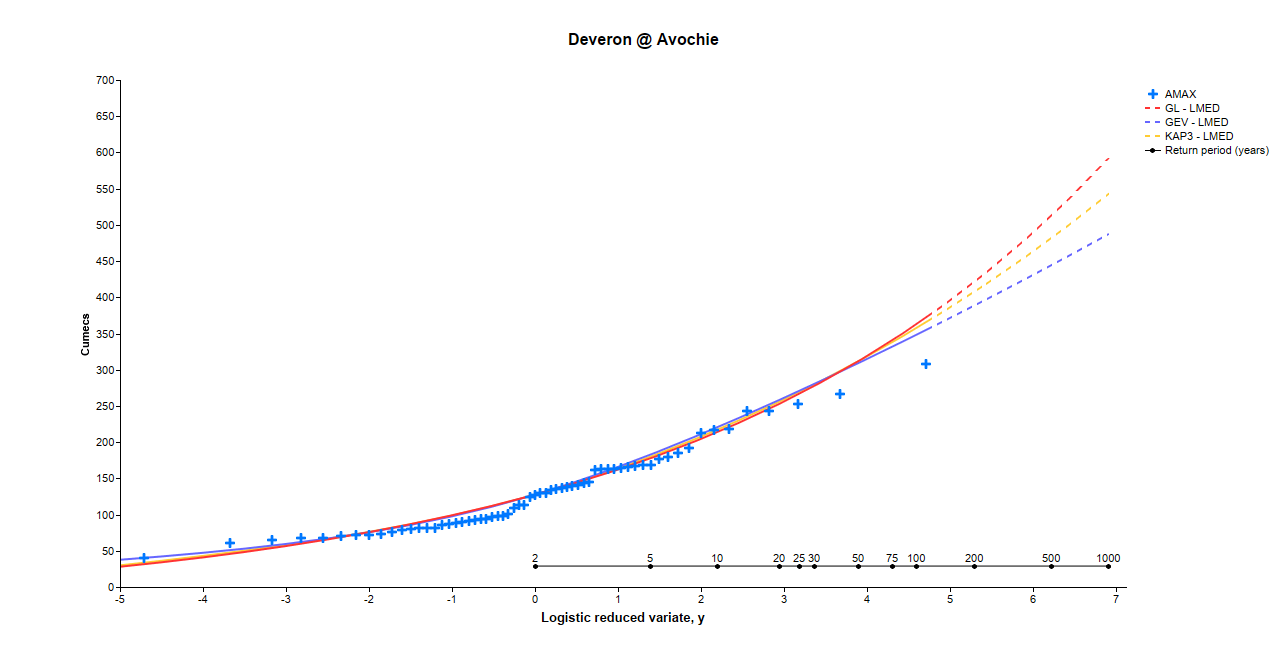
An FFC defines the relationship between the size of a flood (peak flow) and the return period (expected frequency of occurrence), which can be estimated based on observed data. Observed data, usually annual maxima data (AMAX), the highest peak flow for each hydrological year, are fitted to an extreme value distribution. WINFAP estimates peak flows for a given return period through the fitted parameters of a distribution using a number of distributions and fitting methods. An example Single Site Analysis FFC is presented below for the Deveron at Avochie using observed AMAX data fitted to the Generalised Logistic (GL), General Extreme Value (GEV) and Kappa 3 (KAP3) distributions.
Flood frequency curves are often normalised by rescaling using the QMED (the median annual peak flow that has a return period of approximately 2 years) to produce a growth curve. An example growth curve for Deveron at Avochie is shown below.

Introduction to the FEH Statistical Method
The FFC can be estimated in WINFAP for ungauged or gauged sites using the FEH statistical method. The estimation process consists of:
- Estimation of the QMED
- Estimation of the growth curve
- The final FFC is calculated by multiplying the growth curve by the QMED
WINFAP utilises catchment descriptors for a Site of Interest (whether gauged or ungauged) and maximises the use of gauged data to estimate the FFC. Catchment descriptors are available from the FEH Web Service, and the NRFA Peak Flow dataset provides data for over 900 gauging stations.
A number of methods can be used for both estimation of QMED and the growth curve. Most sites that require flood estimates are ungauged, and therefore observed data is not available. For ungauged sites, the pooling method is used to estimate the growth curve. For QMED, the catchment descriptors with donor adjustment method is usually the preferred method. Even where observed data is available, records are often not long enough to estimate peak flows associated with return periods of interest with confidence, therefore the Enhanced Single Site (ESS) method is often used.
The methods are expanded on within this guidance and are largely based on research in Vesuviano and Griffin, 2025, Kjeldsen et al., 2008, Dixon et al., 2017 and Stewart et al., 2019.
Catchment Descriptors
Catchment descriptors, which represent the physical attributes of a catchment, are an integral part of the process of estimating the QMED and the growth curve. These include catchment area, SAAR6190 (standardised average annual rainfall for the period 1961 to 1990) and BFIHOST19scaled (baseflow index estimated using HOST descriptors), which have been found to influence the size and variability of peak flows within a catchment. More details on catchment descriptors can be found from the FEH Web Service and our online tutorials.
Gauging Station Data
The Peak Flow Dataset provides a consistent, quality controlled dataset of catchment descriptors and peak flow data for over 900 gauging stations within the UK provided by the monitoring authorities. It is recommended that appropriate use of local data is maximised, and therefore additional gauged data may also be used in WINFAP. The Peak Flow Dataset has been curated by National River Flow Archive (NRFA) since 2014, and can be downloaded here. Each of the stations are provided with 'indicative suitabilities' according to the hydrometric quality of the gauged record. These state whether they are 'suitable for pooling' or 'suitable for QMED'. Further information on the suitability criteria is provided here.