QMED Estimation
Selection of QMED Method
The QMED can be estimated using a number of different methods. When the Pooled & QMED dashboard is first loaded, the default QMED estimation method is selected according to whether suitable at-site data is available in the NRFA Peak Flow Dataset or supplementary folder. Where possible it is advisable to use at-site data.
The options to incorporate at-site data in QMED estimation is selected by default if:
- the Site of Interest has appropriate AM or POT data (see below for criteria), and
- the station is 'suitable for QMED'.
You can override the default selections if appropriate. It is recommended that you assess the appropriateness of using the data taking into account the above as well as other pertinent station details.
Where at-site data is not available or not selected, the default method selected is the Donor Adjustment method. This calculates the QMED using Catchment Descriptors but adjusts this using local data, which is normally advantageous for most ungauged sites. It is advised that you select the most appropriate method for the site.
You can also provide a User Defined value, which is assumed to be the 'as-rural' estimate. If this value is based on observed data, which already includes the impact of urbanisation, it should be deurbanised using the UAF presented in the dashboard if necessary.
The different methods are summarised below. Further details relating to the uncertainty (FSE) of each method are provided in Griffin et al. (2025), which also includes methods for estimating the combined uncertainty associated with the QMED and Growth curve for a number of return periods and donor stations (the latter related to those used for the estimation of QMED).
QMED from Annual Maxima data
A minimum of 14 years of gauged data is recommended for estimating QMED from Annual Maxima data. QMED is estimated as the median of the ranked Annual Maxima flood series.
QMED from Peaks Over Threshold data
The FEH states that QMED can be estimated from Peaks Over Threshold (POT) data for gauged stations containing between 2 and 20 years of data. This option will be ungreyed if the number of years of POT data is less than 20 years and greater than 0. This will be selected as the 'best' option if there is less than 14 years of AMAX data and the number of years of POT data is greater than the number of AMAX.
Further information can be found in the Flood Estimation Handbook Volume 3, Section 12.3.
QMED from Catchment Descriptors
If the Site of Interest is ungauged or has only a very short record of AM or POT data (less than two years) the catchment descriptor (CD) method may be selected for estimation of QMED. This method involves the use of an equation established for essentially ‘rural’ catchments which derives QMED from catchment descriptors. The equation is presented below and further information is available in Vesuviano and Griffin, 2025.
In many instances this estimate should then be refined using Donor Adjustment.
The catchment descriptor QMED equation for the 2008 method can be found under Legacy Methods
QMED from Catchment Descriptors with Donor Adjustment
The Catchment Descriptor estimate of QMED can be refined using Donor Adjustment, as detailed in Kjeldsen et. al., 2014 and updated within Vesuviano and Griffin, 2025.
A table of suitable candidate stations for use as donor stations is presented on the Donor Adjustment tab.
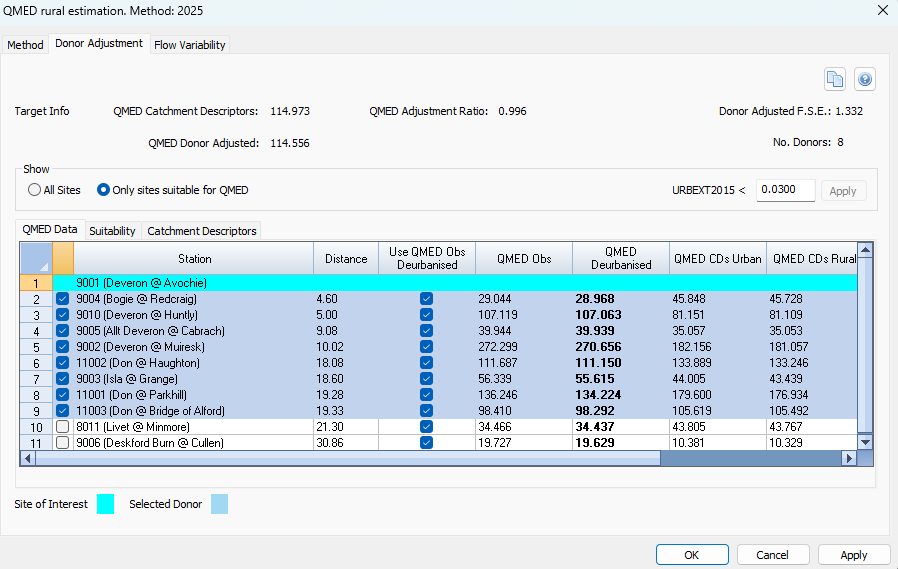
This contains the ten stations with the lowest geographic distance (using catchment centroids). The stations are selected from those in the Station Manager, that:
- are deemed as 'suitable for QMED'; and
- have an URBEXT2015 value that is less than the threshold previously set. By default this is 0.03, categorised as 'essentially rural'.
Both these criteria can be changed under the 'Show' section. You can show 'All Sites' or ‘only sites suitable for QMED’, as well as filter candidate donor stations based on URBEXT2015. In particular it may be useful to change the URBEXT2015 threshold to include urbanised stations that are close in proximity to the Site of Interest. Note you can also modify the default number of donor stations to be listed under Options>User Options on the 'Donor Options' tab.
For a standard estimate, by default, the 8 closest stations are selected for use in the estimation of the rural QMED. You can select and exclude donor stations by selecting the relevant station in the table.
You can inspect various parameters of your donor group stations in the table. The data are tabulated in three tabs: QMED Data, Suitability, and Catchment Descriptors.
QMED data tab
- Distance: this is the distance between the centroids of the Site of Interest and donor catchments in kms.
- QMED Obs, QMED Obs Deurbanised: the QMED from the observed AM data, or the observed QMED which has been deurbanised.
- QMED CDs Urban, QMED CDs Rural: the rural or urbanised QMED calculated using catchment descriptors.
- QMED Ratio: the ratio of the selected observed QMED (either QMED Obs or QMED Obs Deurbanised)to the QMED CDs Rural.
You can select to use the observed or deurbanised QMED values using 'Use QMED Obs Deurbanised' selection box. By default, deurbanisation is applied. The values used in the analysis are shown in bold. See urbanisation procedures for more details on default and recommended settings.
Suitability tab
- Suitability for QMED and/or Pooling.
- Years of data: the number of years of AM data in the record.
- No. of Non-flood years: the number of non-flood years in the record.
- Percentage Non-flood years: the percentage 'non-flood' years the record.
- Mann Kendall (MKZ): the Mann Kendall Z statistic; used to identify whether a trend is present within the data.
- MKZ Significance (%): the significance of the Mann Kendall Z statistic. This is presented as 'none', 5% or 10%.
- Comments: you can add comments to be saved against a station. This could include, for example, reasons why you might reject a station.
- A dynamic link to the NRFA Flow Trend Explorer AMAX plots for the specific station. The 'Triangle Trends' plots can also provide useful information on non-stationarity at a station. Please note that a security certificate warning may be associated with this site. You can over-ride this by proceeding to the 'advanced' option.
See the Non-flood years and Trends section for more details on non-flood years and trends.
Catchment descriptors tab
- Distance: the distance between the centroids of the Site of Interest and donor catchments in km.
- CentroidX: Easting of the centroid of the catchment boundary.
- CentroidY: Northing of the centroid of the catchment boundary.
- AREA: catchment area (km²).
- SAAR9120: Standard Annual Average Rainfall (SAAR) in mm for the period 1991 to 2020, a measure of catchment wetness.
- FARL2015: an index of flood attenuation attributable to reservoirs and lakes based on LCM 2015 (Rowland et al., 2017).
- URBEXT2015: the extent of urban and suburban landcover based on LCM 2015 (Rowland et al., 2017).
- BFIHOST19scaled: a revised Base Flow Index derived using the UK Hydrology of Soil Types (HOST) classification (Griffin et al., 2019) recalculated to remove 'water'.
- A dynamic link to the NRFA station's page.
Legacy descriptors are listed in Legacy Methods.
Any stations that have been modified or those from the supplementary folder will be highlighted using * or + characters respectively.
A colour coding system has been adopted in the table:
- Your Site of Interest is presented in turquoise.
- Blue stations are selected for incorporation into the donor adjustment.
- White stations are excluded from the donor adjustment.
Using the indicative Factorial Standard Error (FSE), located in the top right-hand corner of the donor table, value you can evaluate how the uncertainty of the estimate changes as the donor stations are selected or excluded. Note that the FSE presented does not include sampling error relating to the AM data. If these records are long then this can be assumed to be minimal. In general, differences to the FSE are likely to be small (<0.01).
The adjustment is applied to the 'as rural' Catchment Descriptor estimate of QMED. The QMED estimate for a donor station is therefore deurbanised by default using the inverse application of the Urbanisation procedures.
For more information on the methodological background please refer to Vesuviano and Griffin, 2025.
The donor table and relevant settings, as displayed on the screen, can be copied to the clipboard as comma-delimited text using the 'copy' icon and pasted into external software.
Note that 'Apply' will use the criteria selected in the 'Pooled & QMED Analysis dashboard'. Selecting 'OK' will also use this selection criteria, and return to the 'Pooled & QMED Analysis dashboard'.
QMED from Catchment Descriptors and Channel Dimension
If your Site of Interest is ungauged and you have an accurate measurement of Bankfull Channel Width (BCW) it may be appropriate to use the Catchment Descriptors and Channel Dimension method to estimate QMED. The equation was developed in the Environment Agency R&D Project SC130009 (Dixon et al., 2017). The method is most suited to perennial streams with stable, natural banks and should be used with care. The equation was developed from a much smaller dataset than the CD equation and therefore should not be the preferred method in most cases. In addition, the equation is also sensitive to the way in which BCW is measured.
QMED from Catchment Descriptors and Flow Variability
This method allows you to estimate QMED based on non-flood gauged data available for the station. The use of this equation can significantly reduce the uncertainty in the estimation of QMED when compared with the CD method. Furthermore, the uncertainty is not dependent upon an estimate of contributing catchment area. This equation is therefore useful if there are local gauged data that are not suitable for direct use in the FEH methods due to hydrometric limitations at flood flows. This method requires the following three inputs from gauged data which are available from the NRFA:
- Q5 flow m³/s
- Q10 flow m³/s
- Base Flow Index
For further information on the use of this method, please refer to the WINFAP 4: QMED Linking Equation Technical Note which provides full details of the method and guidance on use.
User Defined Value
A value defined by the user outside of the FEH methods based on alternative approaches. This should represent the 'rural' estimate of the QMED.